Outliers
rackio_AI.Outliers()In statistics, an outlier is a data point that differs significantly from other observations. An outlier may be due to variability in the measurement or it may indicate experimental error; the latter are sometimes excluded from the data set.[3] An outlier can cause serious problems in statistical analyses.
Attributes
- outliers: (dict) Its keys are the dataframe columns with outliers. Keys:
- column_name: (dict) Contains the following keys:
- locs: (list) locations where were the outliers added
- values: (list) Outliers values added
- column_name: (dict) Contains the following keys:
- detected: (dict)
- column_name: (dict) Contains the following keys:
- locs: (list) locations where were the outliers added
- values: (list) Outliers values added
- performance: (float)
- column_name: (dict) Contains the following keys:
- optimizer_result: (pandas.DataFrame)
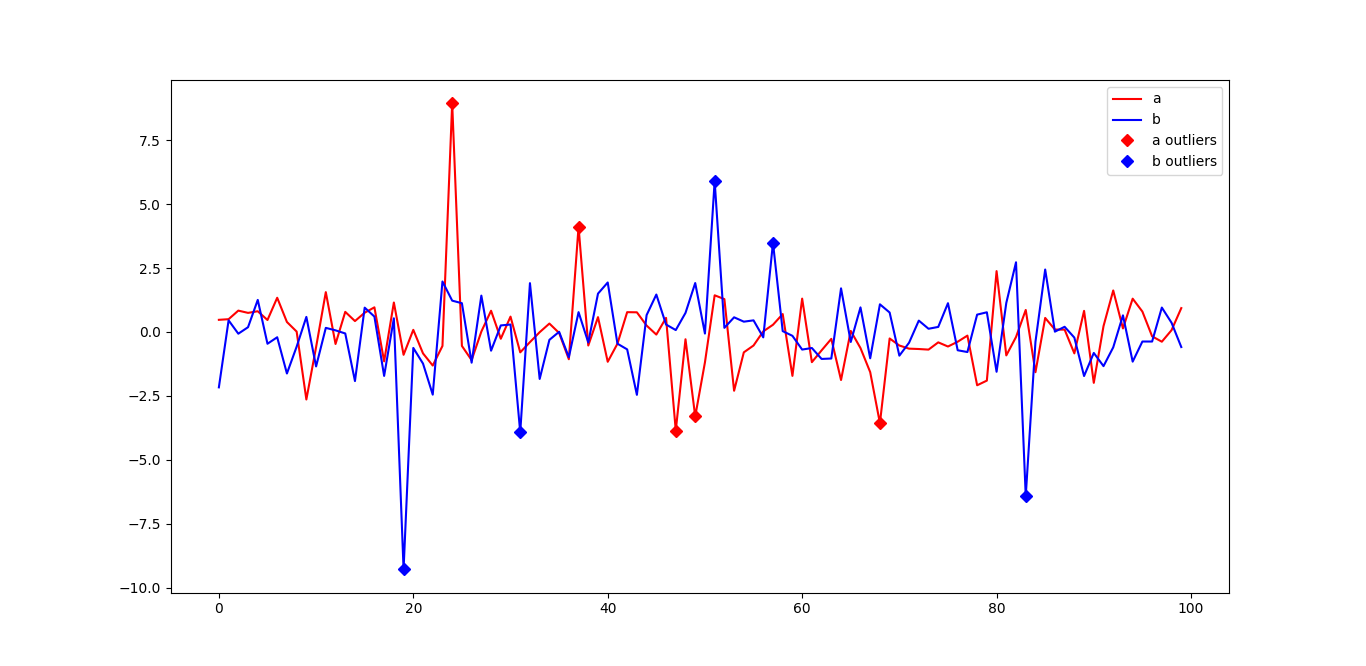
add(self, df, percent=5, method='tf', cols=None)Creates outliers values in a dataframe based on a given method
Parameters
- :param df: (pandas.DataFrame) Data to add outlier
- :param percent: (float) outliers percent
- :param method: (str) custom function name to calculate outlier
- "tf": tukey-fence method
- :param cols: (list) column names to add outliers, default None
- If "None" outliers will be added to all columns
returns
- df: (pandas.DataFrame) Data with outliers added
Snippet code
>>> import matplotlib.pyplot as plt
>>> from rackio_AI import Outliers
>>> df = pd.DataFrame(np.random.randn(100,2), columns=["a", "b"])
>>> out = Outliers()
>>> df = out.add(df)
>>> ax = plt.plot(df["a"], '-r', df["b"], '-b', out.outliers["a"]["locs"], out.outliers["a"]["values"], 'rD', out.outliers["b"]["locs"], out.outliers["b"]["values"], 'bD')
>>> ax = plt.legend(["a", "b", "a outliers", "b outliers"])
>>> plt.show()
tukey_fence(self, subset, k_min=2, k_max=5, q_min=0.25, q_max=0.75)A nonparametric outlier detection method. It is calculated by creating a 'fence' boundary a distance of k values * IQR beyond the 1st and 3rd quartiles. Any data beyond these fences are considered to be outliers.
Outliers are values below q_min-k(q_max - q_min) or above q_max + k(q_max - q_min)
Parameters
- :param subset: (np.ndarray) values to calculate outlier based on interquartile
- :param k_min: (float) lower boundary for tukey fence
- :param k_max: (float) upper boundary for tukey fence
- :param q_min: (float) between [0 - 1] lower quartile
- :param q_max: (float) between [0 - 1] upper quartile
returns
- value (float) outlier value
z_score(self, df, threshold=3)Rejects outlier values based on z-score modified
Parameters
- :param df: (pandas.DataFrame)
- :param threshold: (float)
returns
- y: (list)
iqr(self, subset, q_min=0.25, q_max=0.75)A nonparametric outlier detection method. It is calculated by creating a 'fence' boundary a distance of k values * IQR
Parameters
- :param subset: (np.ndarray) values to calculate outlier based on interquartile
- :param q_min: (float) lower quartile
- :param q_max: (float) upper quartile
returns
- iqr (tuple) (q_min, q_max, iqr)
- q_min lower quartile from a subset
- q_max upper quartile form a subset
- iqr interquartile
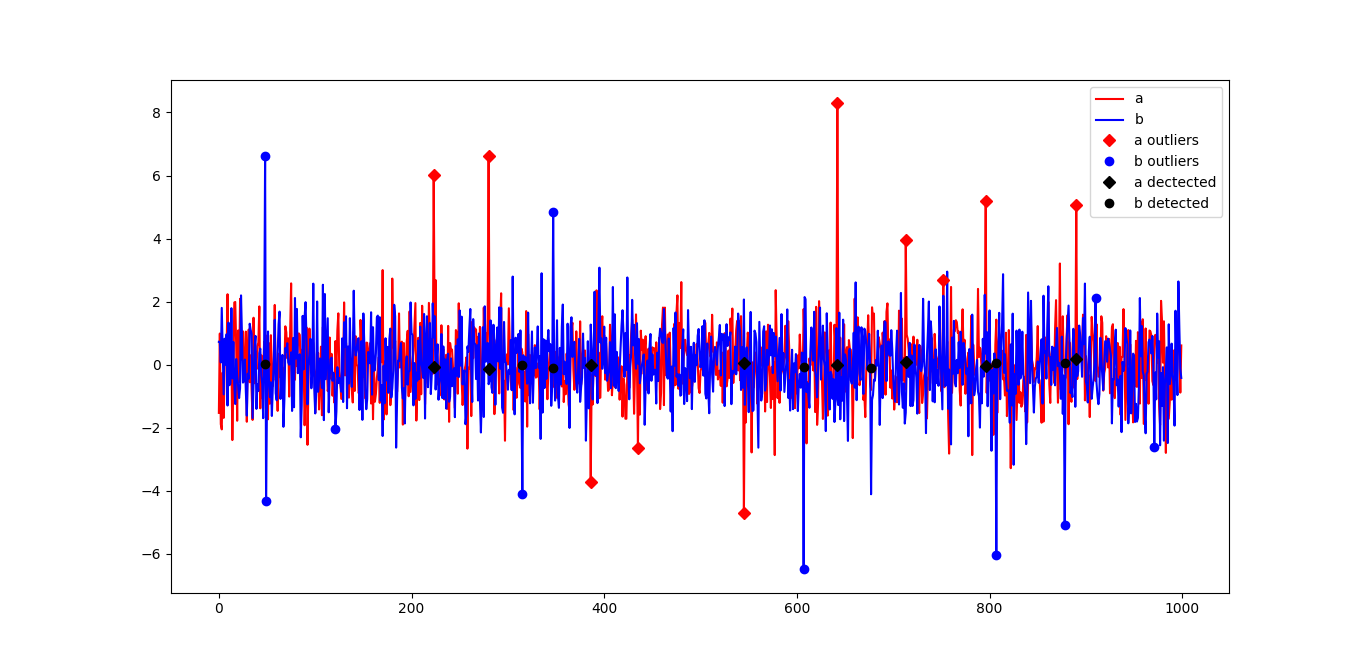
detect(self, df, win_size=30, step=1, conf=0.95, cols=None)Detects any outliers values if exists in dataframe. If exists these outliers values will be imputed.
Parameters
- :param df: (pandas.DataFrame)
- :param win_size: (int)
- :param step: (int)
- :param conf: (float)
- :param cols: (list)
returns
- df: (pandas.DataFrame)
Snippet code
>>> import matplotlib.pyplot as plt
>>> from rackio_AI import Outliers
>>> df = pd.DataFrame(np.random.randn(1000,2), columns=["a", "b"])
>>> out = Outliers()
>>> df = out.add(df, percent=1)
>>> df_imputed = out.detect(df, win_size=30)
>>> ax = plt.plot(df["a"], '-r', df["b"], '-b', out.outliers["a"]["locs"], out.outliers["a"]["values"], 'rD', out.outliers["b"]["locs"], out.outliers["b"]["values"], 'bo', out.detected["a"]["locs"], out.detected["a"]["values"], 'kD', out.detected["b"]["locs"], out.detected["b"]["values"], 'ko')
>>> ax = plt.legend(["a", "b", "a outliers", "b outliers", "a dectected", "b detected"])
>>> plt.show()
check(self, value, subsets, col)Check if any value is an outlier in subsets using sliding windows and z-score modified
Parameters
- :param value: (float) Value to check if an outlier value
- :param subset: (list) Dataframes list with sliding windows
- :param col: (str) Column name where belongs value in the dataframe
returns
status_outlier: (bool) If true the value is an outlier
impute(self, value, sample, conf=0.95)Imputes outlier values using Auto Regressive method with two lags
Parameters
- :param value: (float)
- :param sample: (pd.Series)
- :param conf: (float)
returns
- value: (float)
best_win_size_step(self, df, grid_type, *args, **kwargs)Grid search of window and step size for sliding windows problems
Parameters
- :param df: (Pandas.DataFrame)
- :param grid_type: (str)
- :param args:
- win_sizes: (list)
- steps: (list)
- :param percent: (float)
returns
- df: (pandas.DataFrame)
get_best_window_step_size(self)Get best window and step size after optimization
Parameters
None
returns
best_win_size, best_step_size (Tuple of int values)